
Photoshop Split Screen
TRACCE no. 11 – by John M. Brayer, Henry Walt, Bruno David
In this paper we report on quantitative measures of comparison of two rock art recordings. We conclude that free hand drawing is very inaccurate and that experts may be no better than beginners at accurate recording
![]()
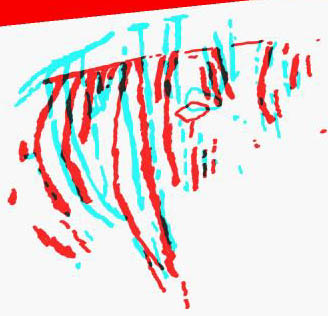
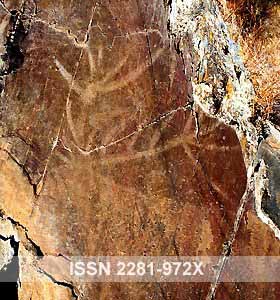
Composite Image Showing the Overlaps of Two Drawings
This study attempts to improve the quantitative understanding of one of the most frequently used methods of rock art recording, freehand drawing. Although this method is very commonly used, its properties are not very well understood and have not been studied quantitatively. This paper identifies and attempts to control the objective sources of error in rock art recording by freehand drawing. We compare the results of about 18 persons attempting to record the same panels and we derive quantitative measures of their geometric and content inaccuracies. We conclude with some suggestions about methods that might be used to minimize these errors.
The most frequently employed recording technique is probably photography. But freehand drawing has been a popular rock art recording technique for many years. Some of the criteria used to evaluate these technologies include image completeness, geometric and content accuracy and efficiency. By image completeness, we mean recording all properties of the object even when the glyph is very faint or difficult to decipher. Drawing has the advantage of being inexpensive and requiring little extra equipment. Drawing allows the recorder to use his/her interpretation to fill in details that are very faint in the original. This, of course, has both positive and negative consequences.
That is, the subjectivity of interpretive conventions can become a help to fill in missing data but can also lead to serious errors. Faintness and superposition are common problems in rock art that are perhaps best overcome by drawing and tracing techniques. Drawing, sketching or drafting is likely to be inaccurate even if methods are tightly regulated. Drawing also has the disadvantage of requiring substantially more time and skill by the recorder than does photography. Drawing is faster than tracing but less accurate. Sketches or drawings have another advantage over tracings in that they avoid rock contact.
We report here on the first steps we are taking in a process to quantify and improve on free-hand drawing as a recording method. The study reported here began with 2 basic hypotheses. The first hypothesis is that general untrained recorders do not do a very good job of recording, especially when the subject is indistinct and relatively inaccessible. We believe that the purpose of recording is two-fold. First, it is important for the recorder to get the general geometry right. Secondly, the recorder should be very careful not to miss any of the details and should pay particular attention to indistinct areas. We think that in general, recorders spend too much time concentrating on the difficult job of getting the geometry right and often neglect the task of studying the details and the indistinct areas.
Our second hypothesis is that recorders will do much better if given a copy of a photographic image on a piece of paper on which they can make various corrections, additions and annotations. In this way, they are already starting with the correct geometry and can concentrate their whole attention on details and indistinct areas, with the distinct areas already well recorded on the photograph. We further believe that such a recording method will be invaluable to scholars studying the materials later, away from the site, because they have both the photo and the annotated drawing for comparison. And the photo and the drawing are rendered in the same geometry.
Previous Studies
In his 1988 paper, Layton [1] also asked several students to record the same panel in a cave in northern Spain that Breuil documented in 1911 [2]. But, as Layton states,
“In no case should it be assumed observers of this panel of engravings have undertaken a purely empirical exercise in discovering ‘what is really there’. On the contrary, they have scanned the wall for what they regard as plausible interpretations.”
Layton was primarily interested in interpretations. Our purpose here is to develop quantitative measures of variations in recordings. Some of those variations, especially when the figures are relatively indistinct, will be due to different interpretations.
But many of the variations will be due to simpler factors associated with the recording process and thus might be controlled in ways that lead to more consistent recording.
The methods used in this paper for registration of images are based on the technology of image registration that is a standard method in digital image processing [3]. To our knowledge it has not been applied in rock art recording previously. This method is frequently used in geographic information systems to register map data and aerial photography. One of the authors has used it previously to detect art forgeries and in bibliographic research [4].
Selection of Original Sites and Drawings
We describe an experiment here in which 18 people with various levels of experience were all asked to record the same panels. We then digitize photographs of the panels and we digitize the drawings. After applying an image registration technique to the photos and drawings, the images are compared quantitatively.
The panels selected here in this first stage of the study were selected primarily for convenience. While we would normally select a more distinctly defined set of glyphs for a study like this, in this case these were the glyphs available when the 18 people were ready to do the drawing. These drawings were records of panels at an Aboriginal site on Mt. Mulligan in Queensland, Australia. The panels represent a wide range of distinguishability. They represent figures that are not easily recognizable and they are in a position in a rock shelter that is relatively inaccessible.
Photographs
Photographs of each panel were taken to the best of our ability. These photos were not as good as we would have liked, but they were the best that could be obtained, given the relative inaccessibility of the panels in the rock shelter. They represent one of the more difficult photo situations and present a nice opportunity to demonstrate how geometric mapping can improve photographic records even in situations where good photographs are not possible.
Drawings and Drawers
The drawings for this experiment were made by 18 members of an Earthwatch team on a field expedition during the summer of 1997. The members ranged in experience from professional archeologists with extensive experience with rock art from this region to artists with little rock art experience to complete novices.
Digitization and Selection of Control Points
The photographs and freehand drawings from the study were digitized on a flatbed scanner. The photographic images were stored in the computer in JPEG format and the drawings were stored in GIF format. Both types of images were displayed using an image processing program (Adobe Photoshop) so that digital tracings of the photos and drawings could be developed and the pixel coordinates of key “control points” in the images could be recorded. The next figure shows a split screen in Photoshop of an original photograph and its tracing (the original photo on top and the tracing on the bottom).
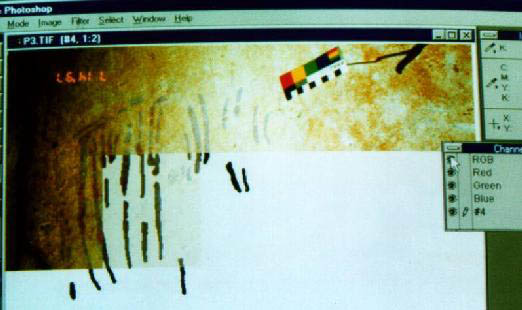
Adobe Photoshop Split Screen of Original Photo (top) and Tracing (bottom)
The next step is to get ready for registration of the images. To do this, we need to select control points for the images. A control point is an easily identified reference mark of some kind in the figure or glyph that can be used as a basis for image registration. These are the points we are going to try to make match during the registration process. We wish to find these marks in all of the drawings and photographs and they should be spread out over the images to make sure all parts of the images register properly. The registration process will ensure that these control points match geometrically as closely as possible. If the control points match, the rest of the images should match also. Any failures to match will be due to the fact that the images are not geometrically conformable. The following figure shows one of the images of a drawing with the 8 control points identified by squares with the diagonals connected.
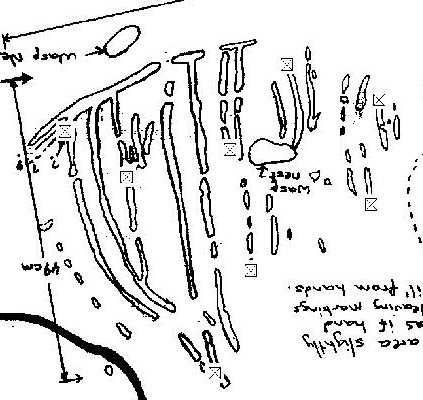
Original Image with Control Points
Calculating the Image Mapping Coefficients
As an image is registered, each point at position (x,y) in the original image is mapped to a new position (x’,y’) in the new registered image according to the mapping:
x’ = a*x + b*y + c + Ex
y’ = d*x + e*y + f + Ey
The coefficients, a, b, c, d, e, and f, define the mapping from the old image (x,y) to the new image (x’,y’). These coefficients are derived by using the control points to do a least squares solution for the coefficients. The Ex and Ey factors represent the errors in the mapping and these can be used as a quantitative measure of the quality and consistency of the geometry of the recordings. So from the control points we can derive the mean squared values of these errors.
Calculating the New Registered Image
If the images were all exact geometric copies of the same figure and if the figure were planar, all of the drawings and photos would be mapped by a planar mapping onto a consistent geometric plane. That is, under the above assumptions, we should be able to register the images exactly. The registration would correct for any translation, orientation and scale differences in the original image. Here, because we know the drawings are not exact copies, we expect differences even after registration. But by doing the registration we are eliminating the translation, orientation and scale differences (which are unimportant) and only have warping and drawing error differences left. Below a figure shows a reference image (left) and another image before (center) and after (right) it has been mapped to match the geometry of the reference image. Notice that before registration the second image (center) appears smaller than the reference (left) and the bars along the tops seem at different angles. The effect of the registration on the second image (right) is to expand its width and rotate it slightly counterclockwise. A careful check of the control points in the left and right images will show they match reasonably well.
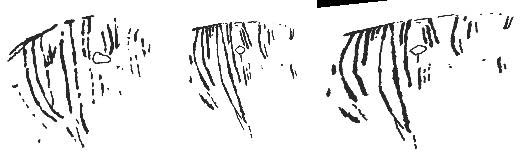
Three Panel Image Showing Reference Image, (left) A Second Image Original (center) and the Second Image Registered to the First (right)
Results
Finally, once the images have been mapped onto a consistent geometry, we can measure quantitatively the agreement between the 2 drawings. Again, we want quantitative measures because we want to compare different recording methods.
The first measure we can use is the average error which was derived from the least squares solution for the coefficients for the control points. For the images above, the average error in matching a control point was about 8% of the width of the figure. This is very large and shows the basic lack of geometric correspondence between the 2 drawings.
The second measure we can use to compare the drawings is the percentage of the areas of the features of the image that overlap. These percentages represent the agreement in the content of the drawings and can be used as another quantitative measure of the recording quality. The figure at the beginning of the paper shows the overlapped images including the areas that are equal and the areas that differ. In this figure, areas that are black and areas that are white are areas that agree. Red and cyan areas are areas that differ. Again we can see there is significant disagreement between the 2 drawings.
The degree of mismatch shown here is not typical of the 18 drawings that were made. In fact most of the others were far worse. To illustrate how these measures might be used, 4 of the 18 drawings and 2 photos of the panel were compared by the 2 measures. Two of the drawings were by people who might be regarded as rock art “experts.” Two were by people with no art training of any kind, termed, “beginners.” And two different photos were compared. The results are summarized in Table 1.
|
Table 1 |
||
|
Recorder \ Result |
Average Error in Control Points After Registration |
Average Overlap in Image Traced Area After Registration |
|
Photos |
6 |
29% |
|
Expert Drawings |
18 |
29% |
|
Beginner Drawings |
18 |
17% |
We should emphasize that these error figures are not based on enough samples to be regarded as statistically significant. But we intend to apply this method to more samples and the results are certainly intriguing. If the results hold up under more samples, it means, at least for these types of panels, that expert drawings are no more accurate than those of beginners and that both are worse than recording a photograph.
Discussion
In addition to normal drawing, with modern digital equipment in the field, it is possible to use digital photographic guided drawing. This concept begins with a digital photograph taken by a digital camera. This photograph is then transferred to a printer, either directly or by way of a laptop computer. The image is then printed lightly (i.e. very low contrast) on paper. This printout can be accomplished in the field with a digital camera, a portable printer and possibly a laptop computer. The recorder can then return to the rock art and compare the printed image to the original glyph, making sketches of added areas or deleted areas in addition to other notations. Both the original image and the corrected drawing can be retained in the database for comparison and analysis.
This kind of drawing is a new technique and we cannot predict how useful it will be until we have field-tested it. But it is likely that this method will be very useful and accurate. Drawings produced in this way simply cannot be as inaccurate as those shown above. And the drawer gets to spend more time concentrating on image details without worrying about geometry.
We hope to use some of the methods and quantitative measures developed here to study the effects on drawing accuracy of factors such as
- Simple vs. Complex glyphs
- Faint vs. Distinct glyphs
- The Effect of View Angle
- Recognizable vs. Unrecognizable figures
- Amateur vs. Professional Drawers
Bibliography
- LAYTON, R., 1991, Figure, Motif and Symbol in the Hunter-Gatherer Rock Art of Europe and Australia, Rock Art and Prehistory, Oxbow Monograph 10, pp 23-38.
- ALCALDE del RIO, H., BREUIL, H. and SIERRA, L., 1911, Les Cavernes de la region Cantabrique, Monaco.
- CASTLEMAN, K. R., 1996, Digital Image Processing, Prentice-Hall, pp 115-141.
- STERNBERG, P. R., and BRAYER, J. M., 1983, Composite Imaging: A New Technique in Bibliographic Research, Papers of the Bibliographical Society of America, vol. 77,


back to index TRACCE no. 
![]()
![]()


Leave a Reply